AI for Board Reporting: How CFOs Automate Investor Decks
Oct 04, 2026
Board reporting is the most visible and most manually painful output of the finance function. Workday's 2025 CFO AI Indicator Report found that while 88% of FP&A teams use AI for data analysis, only 66% apply it to narrative generation (Workday, 2025). That gap matters because narrative is exactly what boards consume. Nobody reads the raw data. They read the story.
The typical board deck takes 40-60 hours of FP&A time to produce. Data extraction, chart building, narrative writing, formatting, executive review cycles, last-minute updates when numbers change, it's a sprint that repeats every quarter and eats the team alive.
AI doesn't replace the strategic thinking that makes a great board presentation. It eliminates the 70% of the work that's mechanical assembly i.e. pulling data, drafting commentary, building standardized charts, and formatting slides. This guide covers both board of directors presentations and investor reporting packages (earnings narratives, analyst-ready updates), the same AI workflow applies to both, with adjustments to tone and disclosure requirements. For the broader context of AI's role in finance leadership, see our AIforCFOs guide.
|
TL;DR AI compresses board deck production from 40-60 hours to 8-12 hours by automating data extraction, chart generation, and first-draft narratives. With 66% of FP&A teams already using AI for narrative generation per Workday, the gap is in applying that capability to the highest-stakes document the finance team produces. |
Why Is Board Reporting Still So Manual?
PwC reports that AI agents can deliver up to 40% improvement in forecasting accuracy and speed when deployed in finance teams (PwC, 2026). Yet board reporting, which sits downstream of forecasting, remains stubbornly manual. Why?
Three structural reasons keep board reporting manual:
- The "last mile" problem. Board decks combine data from five to ten different systems: GL, CRM, HRIS, project management, market data. No single platform has all the inputs, so analysts stitch them together manually every quarter.
- Narrative is subjective. A variance commentary in a monthly report is formulaic. A board narrative requires strategic framing, political awareness, and anticipation of director questions. Finance teams don't trust AI to handle that nuance, so they don't try.
- Formatting requirements are rigid. Every board has a specific template, font, color scheme, and slide order. The last 20% of effort goes into making the deck "look right" rather than making it say the right things.
Here's what the time actually looks like for a typical quarterly board deck:
|
Task |
Effort hours |
Potential to automate with AI |
|---|---|---|
|
Data extraction from multiple systems |
8-12 |
High, API pulls and AI aggregation |
|
Financial chart creation |
6-8 |
High, AI generates from data |
|
Variance commentary and narratives |
10-15 |
High, AI drafts, human edits |
|
KPI dashboards and scorecards |
4-6 |
High, templated with AI updates |
|
Executive review and revision cycles |
8-12 |
Medium, AI handles formatting changes |
|
Last-minute data updates |
4-8 |
High, AI regenerates affected sections |
|
Total |
40-61 |
70% automatable |
Citation: Workday's 2025 CFO AI Indicator Report found 88% of FP&A teams already use AI for data analysis, but only 66% apply it to narrative generation, creating a gap precisely where boards spend the most attention: reading the story behind the numbers, not the numbers themselves ([Workday](https://blog.workday.com/en-us/cfo-ai-indicator-report-how-finance-leaders-use-ai.html), 2025).
What Does an AI-Powered Board Reporting Workflow Look Like?
Deloitte's Q4 2025 CFO Signals survey of 200 finance chiefs found 87% rate AI as extremely or very important, with 54% identifying AI agents as a transformation priority (Deloitte, 2025). Board reporting is where that priority translates into visible executive impact.
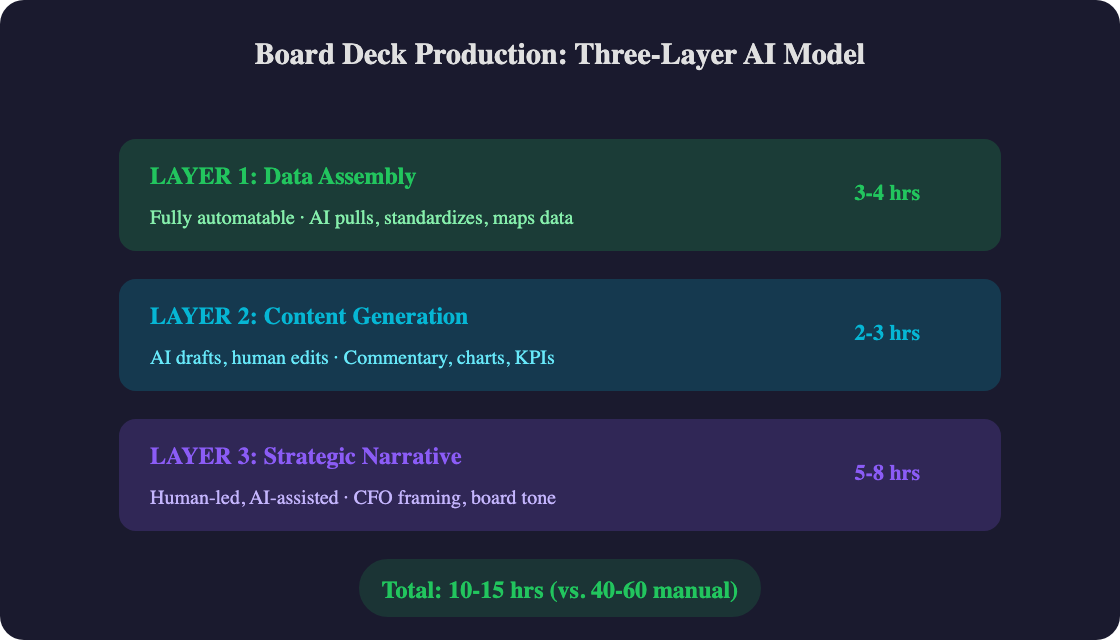
The AI-powered workflow splits into three layers:
Layer 1: Data Assembly (fully automatable)
- AI pulls actuals, KPIs, and metrics from connected systems
- Standardizes data formats and maps to the board template
- Flags missing data points and data quality issues
- Updates automatically when source data changes
Layer 2: Content Generation (AI drafts, human edits)
- AI generates variance commentary for each financial section
- AI drafts executive summary based on key trends and thresholds
- AI creates charts and visualizations from the underlying data
- AI produces KPI scorecards with traffic-light status indicators
Layer 3: Strategic Narrative (human-led, AI-assisted)
- CFO provides strategic framing and forward-looking guidance
- AI suggests talking points based on the data trends it's identified
- Human reviews and adjusts tone for board audience
- AI reformats content into the board's required template
The shift? Layers 1 and 2 drop from 30+ hours to 3-4 hours. Layer 3 stays at 5-8 hours — but it's the right kind of hours. The CFO and FP&A director are spending time on strategic framing instead of formatting pie charts.
|
Contrarian take The best AI-generated board decks aren't the ones that look AI-generated. They're the ones where AI handled the data assembly and first-draft commentary, freeing the CFO to spend four hours crafting the strategic narrative instead of forty hours building the whole thing from scratch. The board doesn't care whether AI or an analyst pulled the data. They care whether the CFO has something sharp to say about it. |
How Do You Build an AI Board Reporting Workflow? Step by Step
The AFP's 2026 benchmarking survey of 332 finance practitioners found teams with structured reporting processes complete budgets 11% faster and report 14% higher strategic alignment (AFP, 2026). Board reporting follows the same principle, structure enables speed.
Step 1: Templatize Your Board Deck
Before involving AI, standardize the structure. Most board decks follow this pattern:
- Executive Summary (1 slide): Key metrics, headline story, outlook
- Financial Performance (3-5 slides): P&L, balance sheet, cash flow with YoY and budget comparisons
- KPI Scorecard (1-2 slides): Traffic-light indicators for 10-15 key metrics
- Segment/Business Unit Detail (2-4 slides): Revenue and profitability by segment
- Strategic Initiatives Update (2-3 slides): Project status, milestones, risks
- Forward Outlook (1-2 slides): Guidance, scenarios, key risks and opportunities
- Appendix (as needed): Supporting detail tables
Create a master template with placeholder fields for each data point. AI fills the placeholders; you control the structure.
Step 2: Connect Your Data Sources
AI needs access to the right data. Map each section of your board template to its data source:
- Financial statements: ERP/GL export (NetSuite, SAP, Oracle)
- KPIs: CRM (Salesforce), HRIS (Workday), product analytics
- Pipeline data: CRM opportunity reports
- Market benchmarks: Industry databases, competitor filings
Start simple. Export CSVs monthly and upload them to your AI assistant. Automate the connections later once you've proven the workflow.
Step 3: Build Section-Specific Prompts
Each section of the board deck needs a tailored prompt. Here are tested examples:
Executive summary prompt:
"Based on the attached Q1 2026 financial data, write a 150-word executive summary for our board of directors. Highlight: (1) revenue performance vs. budget and prior year, (2) the single most important trend, (3) one risk and one opportunity for Q2. Tone: direct, confident, data-driven. Avoid jargon."
Variance commentary prompt:
"For each P&L line item where the variance exceeds $100K or 5%, write a 2-sentence explanation: first sentence states the variance amount and direction, second sentence explains the primary driver. Use specific numbers, not vague language."
KPI scorecard prompt:
"Using the attached KPI data, generate a scorecard table with columns: Metric, Target, Actual, Status (Green/Yellow/Red based on ±5% threshold), and Trend (arrow up/down/flat based on 3-month direction)."
Step 4: Automate Chart Generation
Charts are one of the easiest board reporting elements to automate. Feed AI your data and specify the chart type:
- Waterfall chart: Revenue bridge from budget to actual
- Trend lines: 12-month rolling revenue, margins, cash
- Stacked bars: Revenue by segment or geography
- Traffic light KPI dashboard: Key metrics with red/yellow/green indicators
AI tools with code execution (ChatGPT Code Interpreter, Claude with artifacts) can generate publication-quality charts directly from your data.
Step 5: Implement a Review Workflow
The CFO reviews AI-generated content in a structured pass:
- Data accuracy check (15 min): Verify numbers match source systems
- Narrative tone adjustment (30-60 min): Adjust AI commentary to match your voice and the board's expectations
- Strategic overlay (2-3 hours): Add forward-looking guidance, risk assessment, and strategic recommendations that only you can provide
- Final formatting (30 min): Adjust layout, ensure brand consistency
For comparing which AI handles financial narratives better, see our ChatGPT vs Claude for FP&A analysis.
Citation: Deloitte's Q4 2025 CFO Signals survey of 200 North American finance chiefs found 87% rate AI as extremely or very important to operations, with 54% prioritizing AI agent integration — and board reporting automation represents the highest-visibility use case for demonstrating AI's impact to directors who oversee budget decisions ([Deloitte](https://www.deloitte.com/us/en/about/press-room/deloitte-q4-2025-cfo-signals-survey.html), 2025).
What Are the Best AI Tools for Board Reporting?
NVIDIA's 2026 financial services survey found 97% of firms plan to increase AI investment, with reporting automation ranking among the top use cases (NVIDIA, 2026). Here's how the current tools stack up for board reporting specifically.
For Narrative Generation:
|
AI platform |
Strength |
Weakness |
|---|---|---|
|
Claude |
Best financial reasoning, handles full quarterly data packages in one session, strong narrative quality |
No native slide generation, (though the Claude for PowerPoint is available as an add-in. Claude can also connect with Canva to create slides) |
|
ChatGPT |
Code Interpreter generates charts and tables directly, good at structured templates |
Smaller context window may truncate large data packages |
|
Copilot |
Native PowerPoint integration, generates slides directly |
Financial reasoning less sophisticated than Claude |
For End-to-End Deck Automation:
|
AI platform |
Strength |
Weakness |
|---|---|---|
|
Pigment |
Dashboard-to-deck export with AI commentary |
Teams wanting integrated planning + reporting |
|
Cube |
Board pack automation with AI-generated narratives |
Mid-market teams on Excel-based workflows |
|
Workday Adaptive |
Native board reporting with AI insights |
Enterprise Workday customers |
|
Practitioner note In my experience building board packages for multiple finance teams, the draft-to-final cycle drops from 5-6 revision rounds to 2-3 when AI handles the first draft, because reviewers spend their time on substance rather than fixing formatting and grammar. The most effective workflow combines Claude for narrative content and variance commentary (it handles financial nuance better) with Copilot for the final PowerPoint assembly (it handles slide formatting better). Don't try to make one tool do everything, play to each tool's strength. |
For a comprehensive comparison of all FP&A tools, see our best AI tools for FP&A teams in 2026.
What Mistakes Do CFOs Make When Automating Board Decks?
Wolters Kluwer's 2026 survey of 1,672 finance leaders found roughly 60% expect major transformation in FP&A and financial reporting within three years (Wolters Kluwer, 2026). McKinsey's research on AI in finance found that generative AI could automate 60-70% of the time finance employees currently spend on data gathering and basic reporting tasks (McKinsey, 2025). Boards are watching how their CFOs adopt AI. Here are the mistakes that undermine credibility.
- Shipping AI-generated narrative without review. Board directors are sophisticated readers. AI-generated text that reads as generic or formulaic e.g. "Revenue exceeded expectations driven by strong market conditions" will get flagged. Every AI-drafted narrative needs a human editing pass to add specificity, nuance, and the CFO's voice.
- Over-automating the strategic sections. The executive summary and forward outlook are where boards expect the CFO's personal judgment. These sections should be human-written, informed by AI analysis. Automate the financial detail slides. Write the strategy slides yourself.
- Not stress-testing the data pipeline. What happens when the data export changes format? When a new cost center gets added? When the GL mapping shifts? Build validation checks into the AI workflow. The worst possible outcome is presenting wrong numbers to the board because the automation silently broke.
- Ignoring version control. Board decks go through 3-5 revision cycles. If AI regenerates content each time, you risk losing edits the CFO made in a previous pass. Maintain a clear workflow: AI generates v1, humans edit to v2-v5, AI only regenerates specific sections on request.
|
Our benchmark Across board reporting workflows we've tracked, AI automation cuts the CFO's personal editing time from 8-10 hours to 2-3 hours per cycle, the strategic overlay and narrative tone work that only the CFO can do. The 40-60 hours in total deck production drops to 10-15 hours, but the CFO's share of that time drops disproportionately: from 25% of the effort to 20-30% of a much smaller number. That's the real executive time dividend. |
Citation: According to Wolters Kluwer's 2026 survey of 1,672 senior finance leaders across 20+ markets, roughly 60% expect major transformation in financial reporting and FP&A within three years and 85% believe AI will reshape the CFO role within the next year, making board reporting automation not optional but expected ([Wolters Kluwer](https://www.wolterskluwer.com/en/news/pr-2026-future-ready-cfo-report), 2026).
Frequently Asked Questions
How much time does AI save on board reporting?
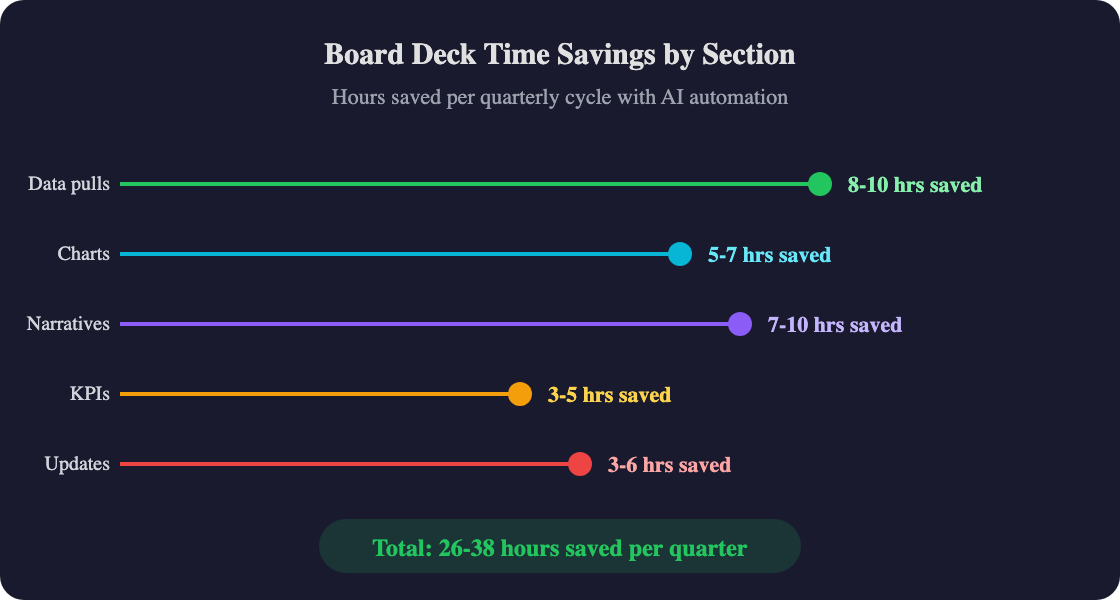
AI typically reduces board deck production from 40-60 hours to 10-15 hours, a 60-75% reduction. The biggest savings come from automated data extraction (8-10 hours saved), narrative drafting (7-10 hours), and chart generation (5-7 hours). Deloitte's 2025 CFO survey found 87% of CFOs rate AI as extremely or very important to finance operations, with reporting as a top deployment area (Deloitte, 2025).
Can AI write an executive summary for the board?
AI produces strong first drafts of executive summaries that are directionally accurate and well-structured. However, the CFO should always review and edit for strategic tone, political nuance, and forward-looking judgment. The best approach: AI drafts the summary from the data, CFO rewrites the opening and closing paragraphs with their personal assessment. Workday found 66% of FP&A teams already use AI for narrative generation (Workday, 2025).
What happens when board numbers change last-minute?
This is where the time savings are most dramatic. In a manual workflow, a late data update means hours of rework across multiple slides. With an AI workflow, you re-upload the updated data and regenerate the affected sections in minutes. AI handles the cascade as updated numbers flow through to charts, commentary, KPI scorecards, and executive summary automatically.
Is AI-generated board content secure enough for confidential data?
Enterprise tiers of Claude (Team/Enterprise) and ChatGPT (Enterprise/Team) offer contractual data privacy guarantees, so your data isn't used for training and is encrypted at rest and in transit. For highly sensitive board materials, Claude Enterprise and ChatGPT Enterprise both offer SOC 2 compliance. See our AI for CFOs guide on risk management for a deeper dive on data security.
How do I get board buy-in for AI-assisted reporting?
Start by demonstrating, not requesting. Produce one board deck section using AI alongside your normal process, then show the board both versions. When they can't tell the difference (or prefer the AI-assisted version), you've made your case. Per L.E.K. Consulting's 2025 survey, only 11% of CFOs currently use AI in finance, but 35% are piloting boards increasingly expect to see AI in operation, not just in the strategy deck (L.E.K., 2025).
What to Do Next: Automate One Section This Quarter
Board reporting is the highest-visibility AI win for CFOs. With 85% of finance leaders expecting AI to reshape the CFO role within a year (Wolters Kluwer, 2026), the organizational will is already there. What's missing is a specific starting point.
Key takeaways:
- 60-75% time savings: AI compresses board deck production from 40-60 hours to 10-15 hours per quarter
- Start with variance commentary: The highest-ROI first step is to upload your P&L data and have AI draft the variance section
- Three-layer model: Fully automate data assembly, AI-draft content generation, keep strategic narrative human-led
- Don't ship without review: AI generates strong first drafts, but board narratives need the CFO's voice and judgment
- Demonstrate, don't pitch: Show the board an AI-assisted section alongside a manual one and let quality speak for itself
For the full picture on how AI transforms every FP&A workflow, see our complete guide to AI in FP&A. Ready to build the financial models that feed your board deck? See our guide on how to use AI for financial forecasting.